Shreyas
Kanagal

Building with

Economics & Business Analytics student at UT Dallas. I turn messy datasets into clean pipelines, actionable dashboards, and live analytics tools, with a focus on finance and investment data.

Shreyas Kanagal
scroll

About

A bit about me

I am a senior at UT Dallas studying Economics with a minor in Business Intelligence & Analytics (GPA 3.94). My focus is on the intersection of finance and data: building systems that turn raw numbers into decisions people can act on.

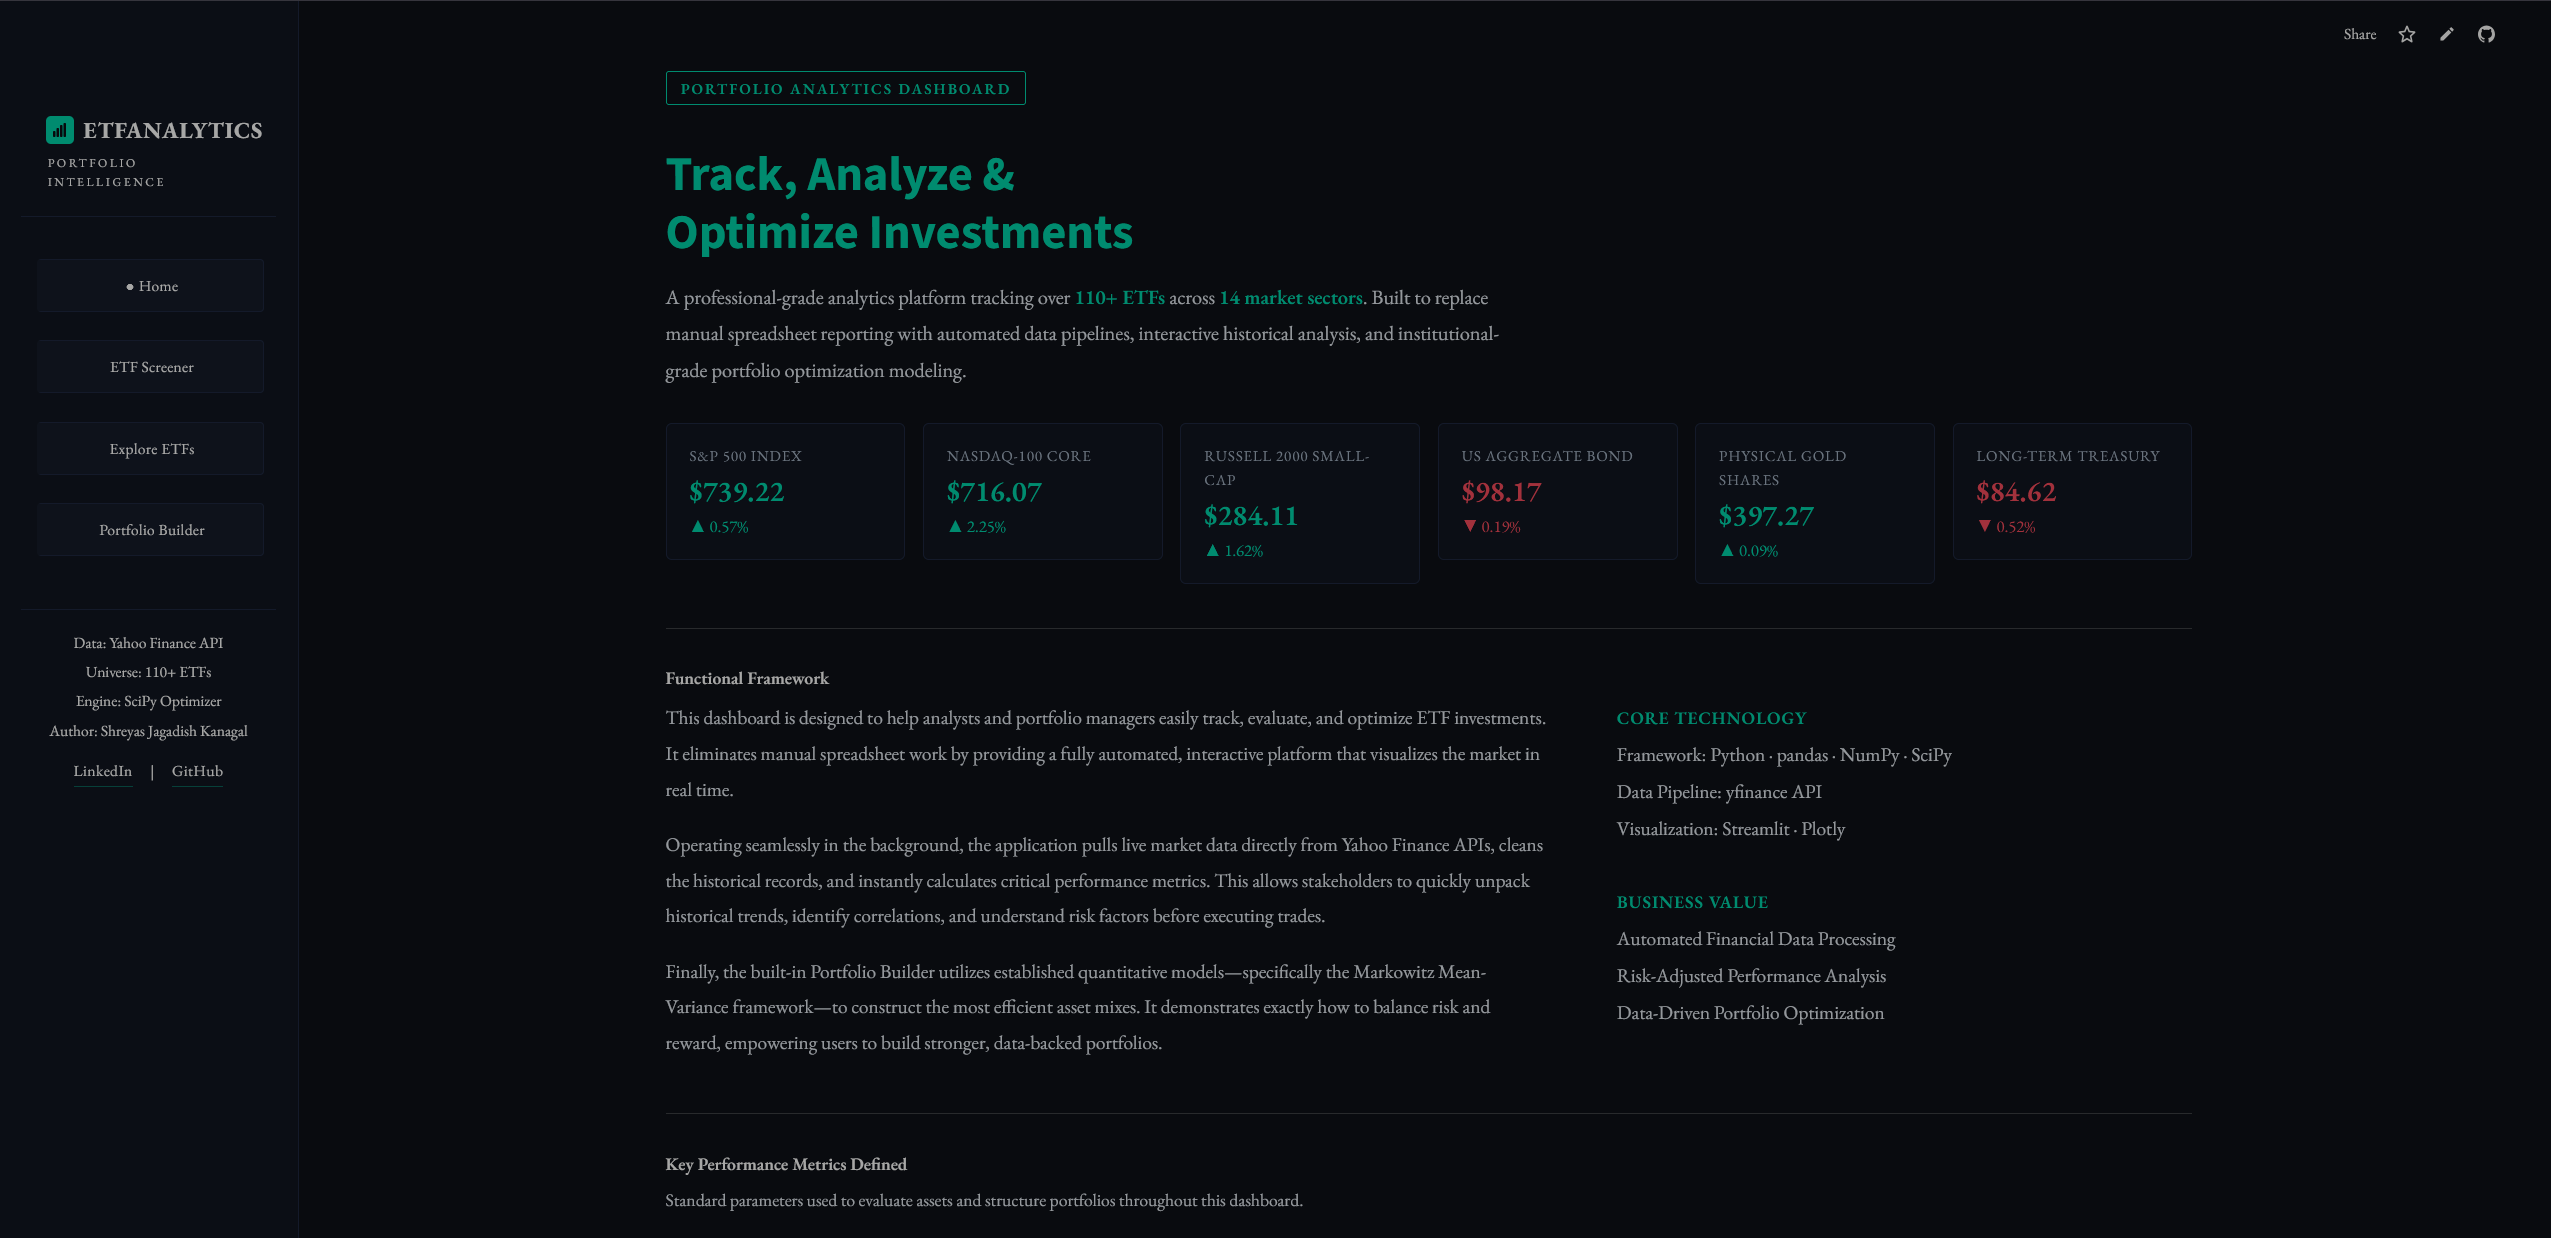
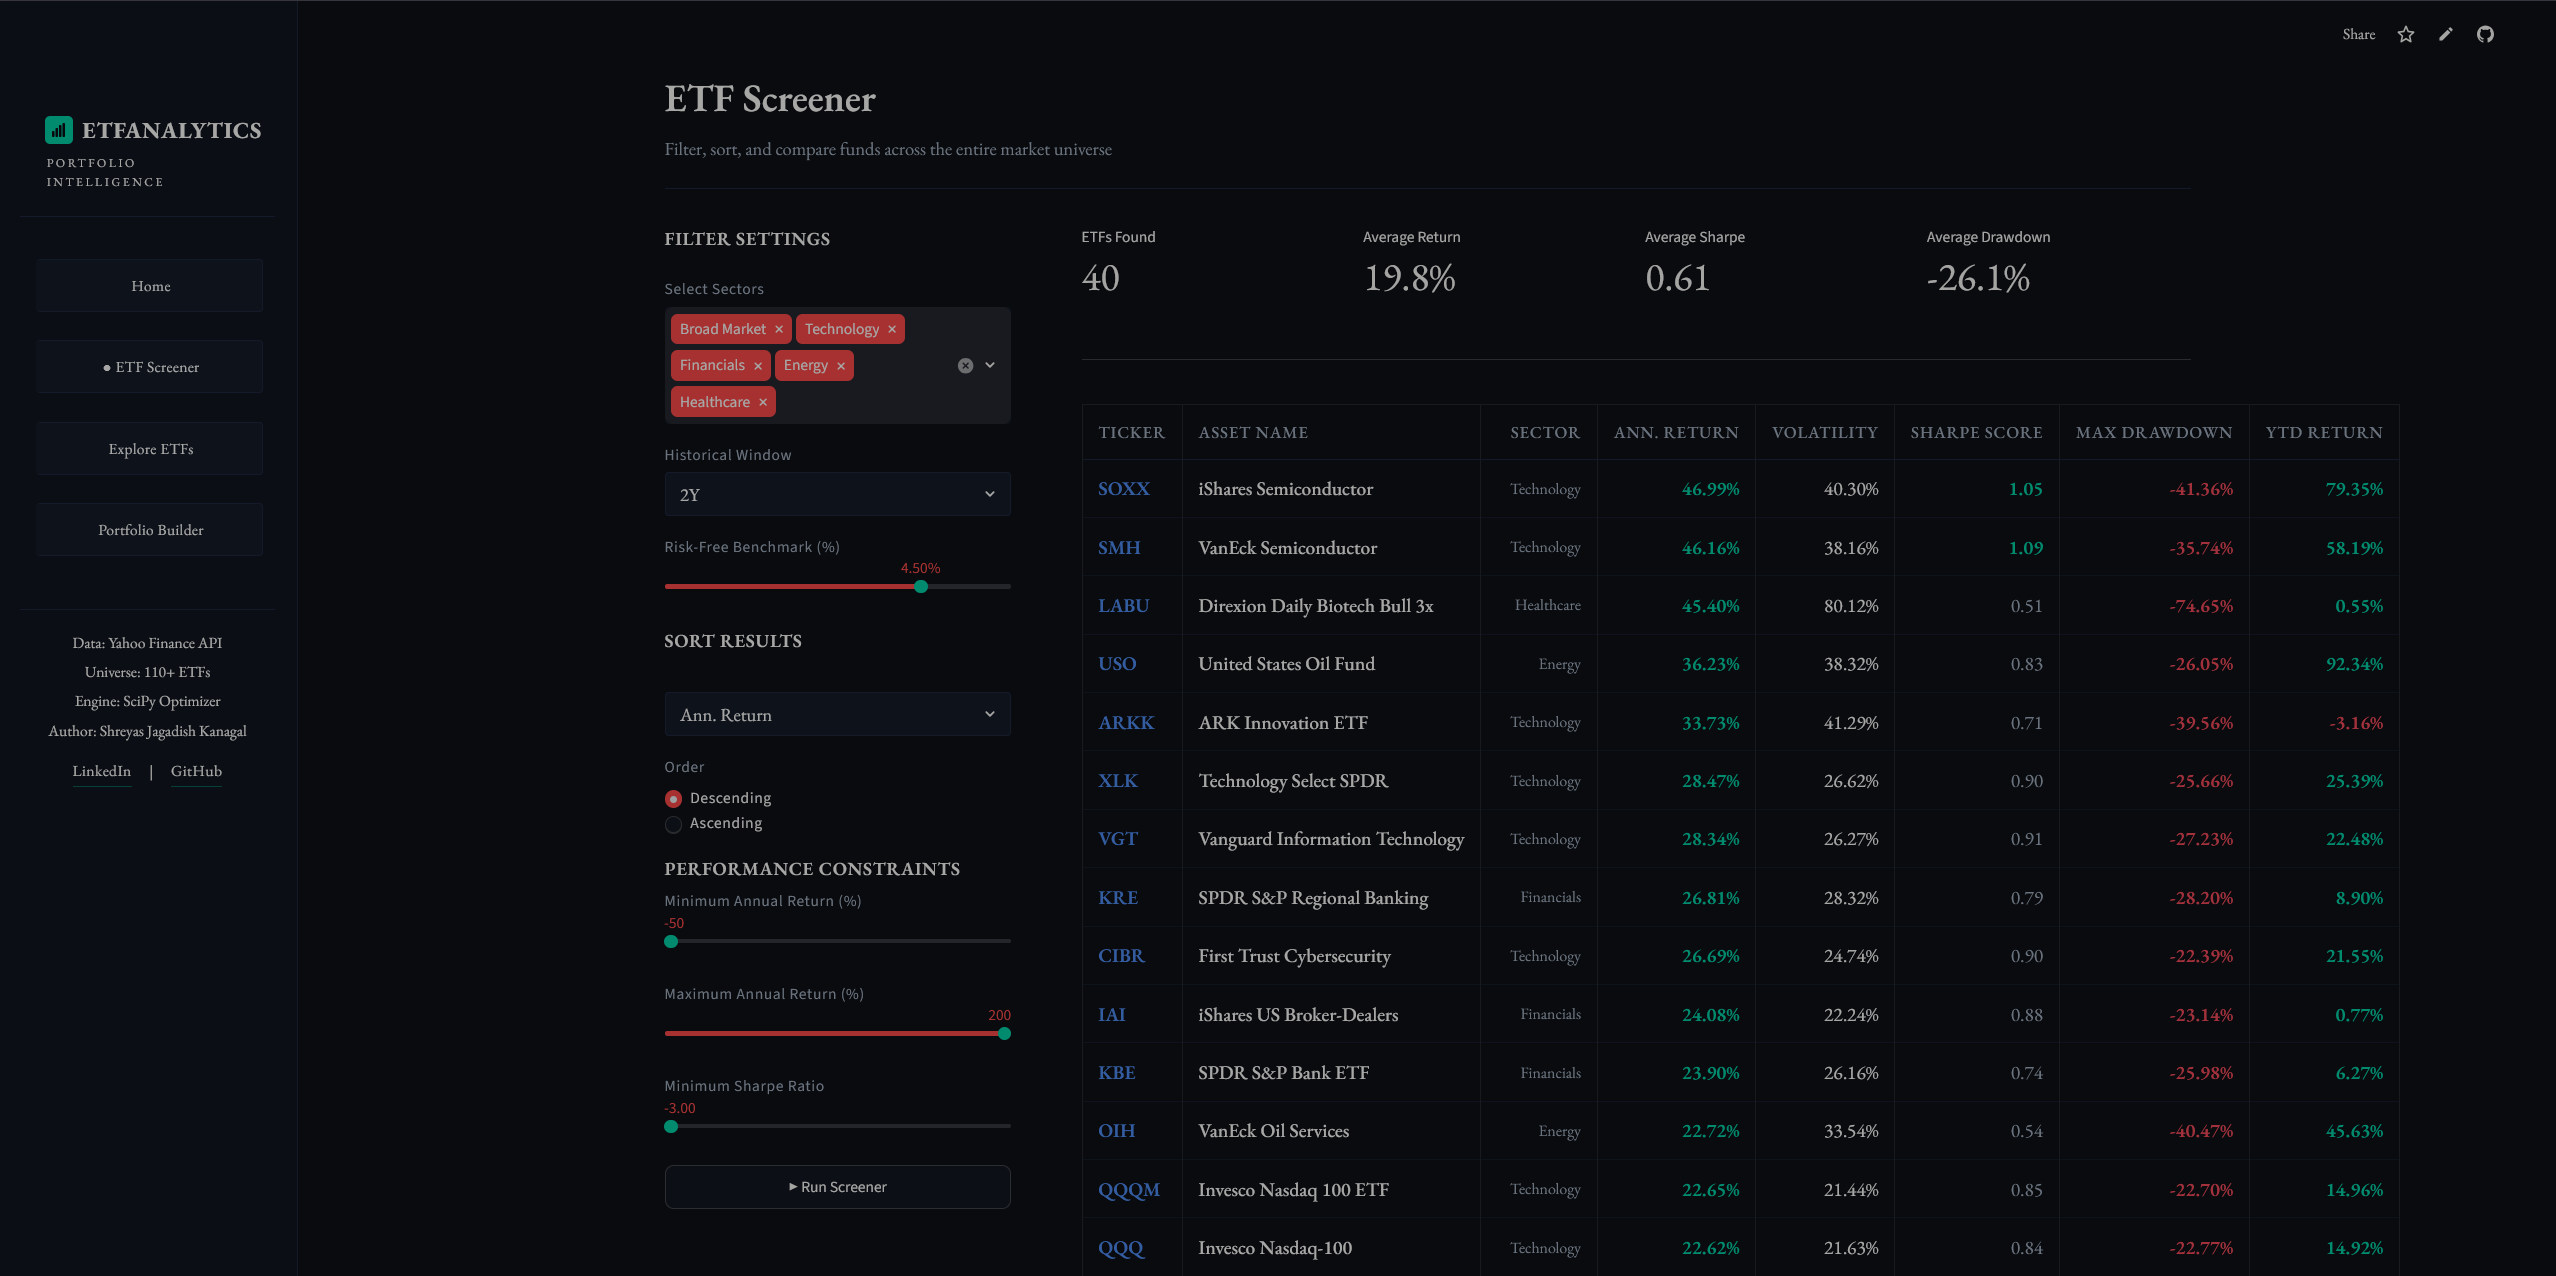
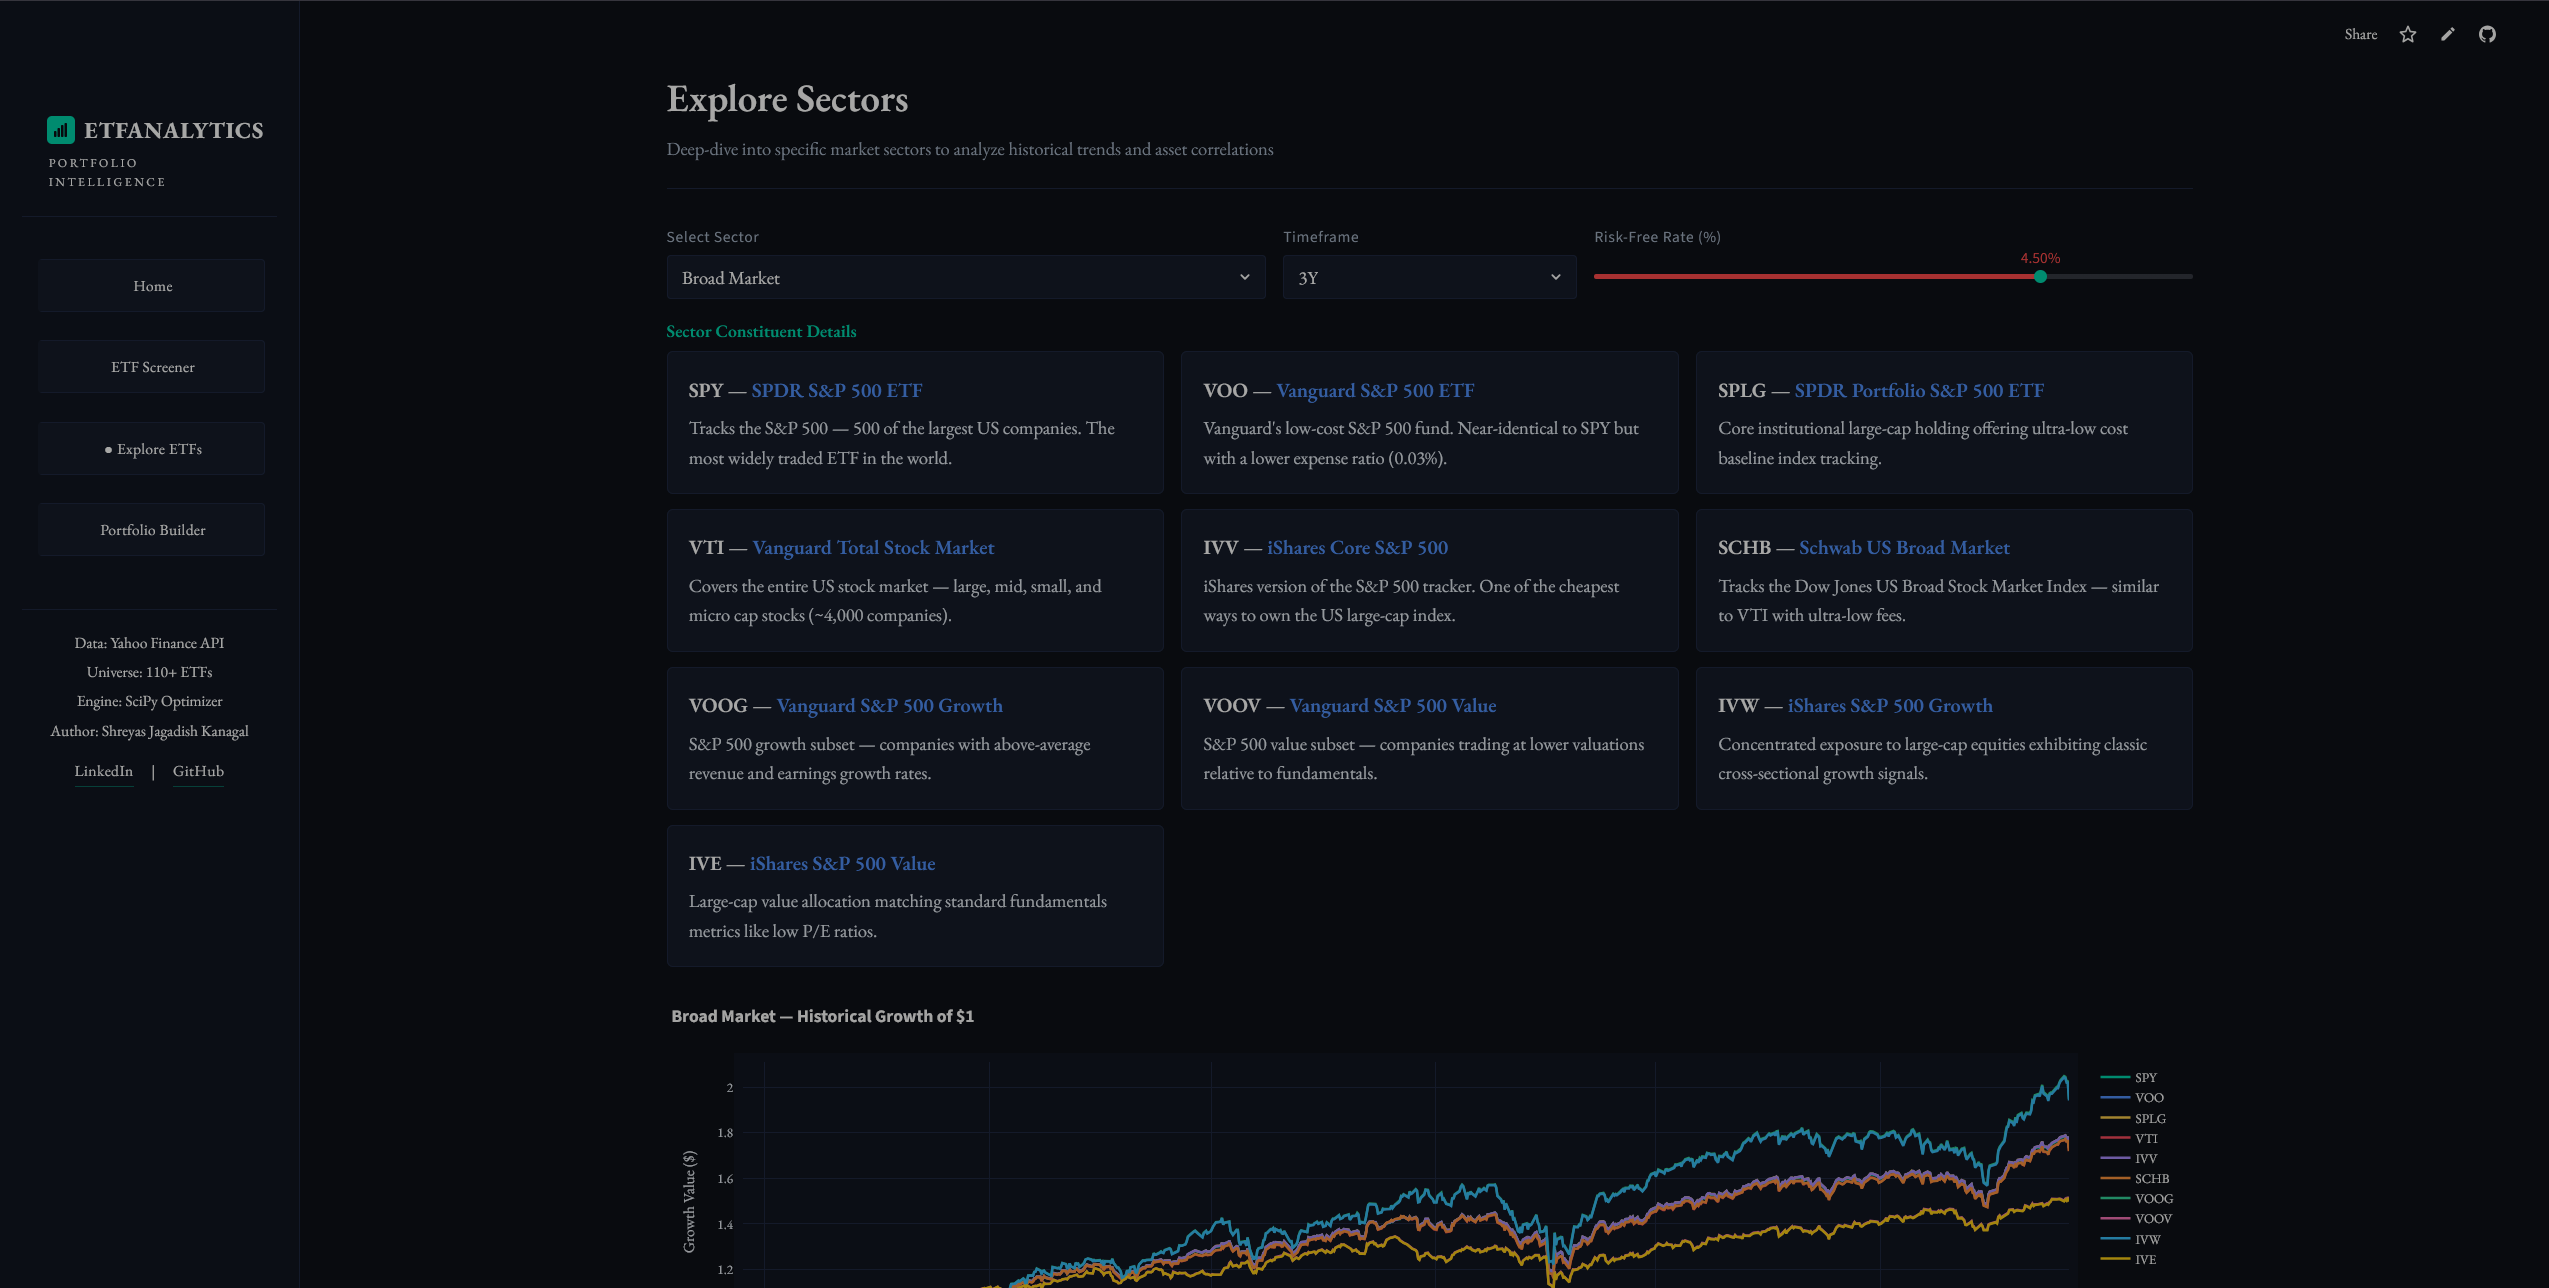
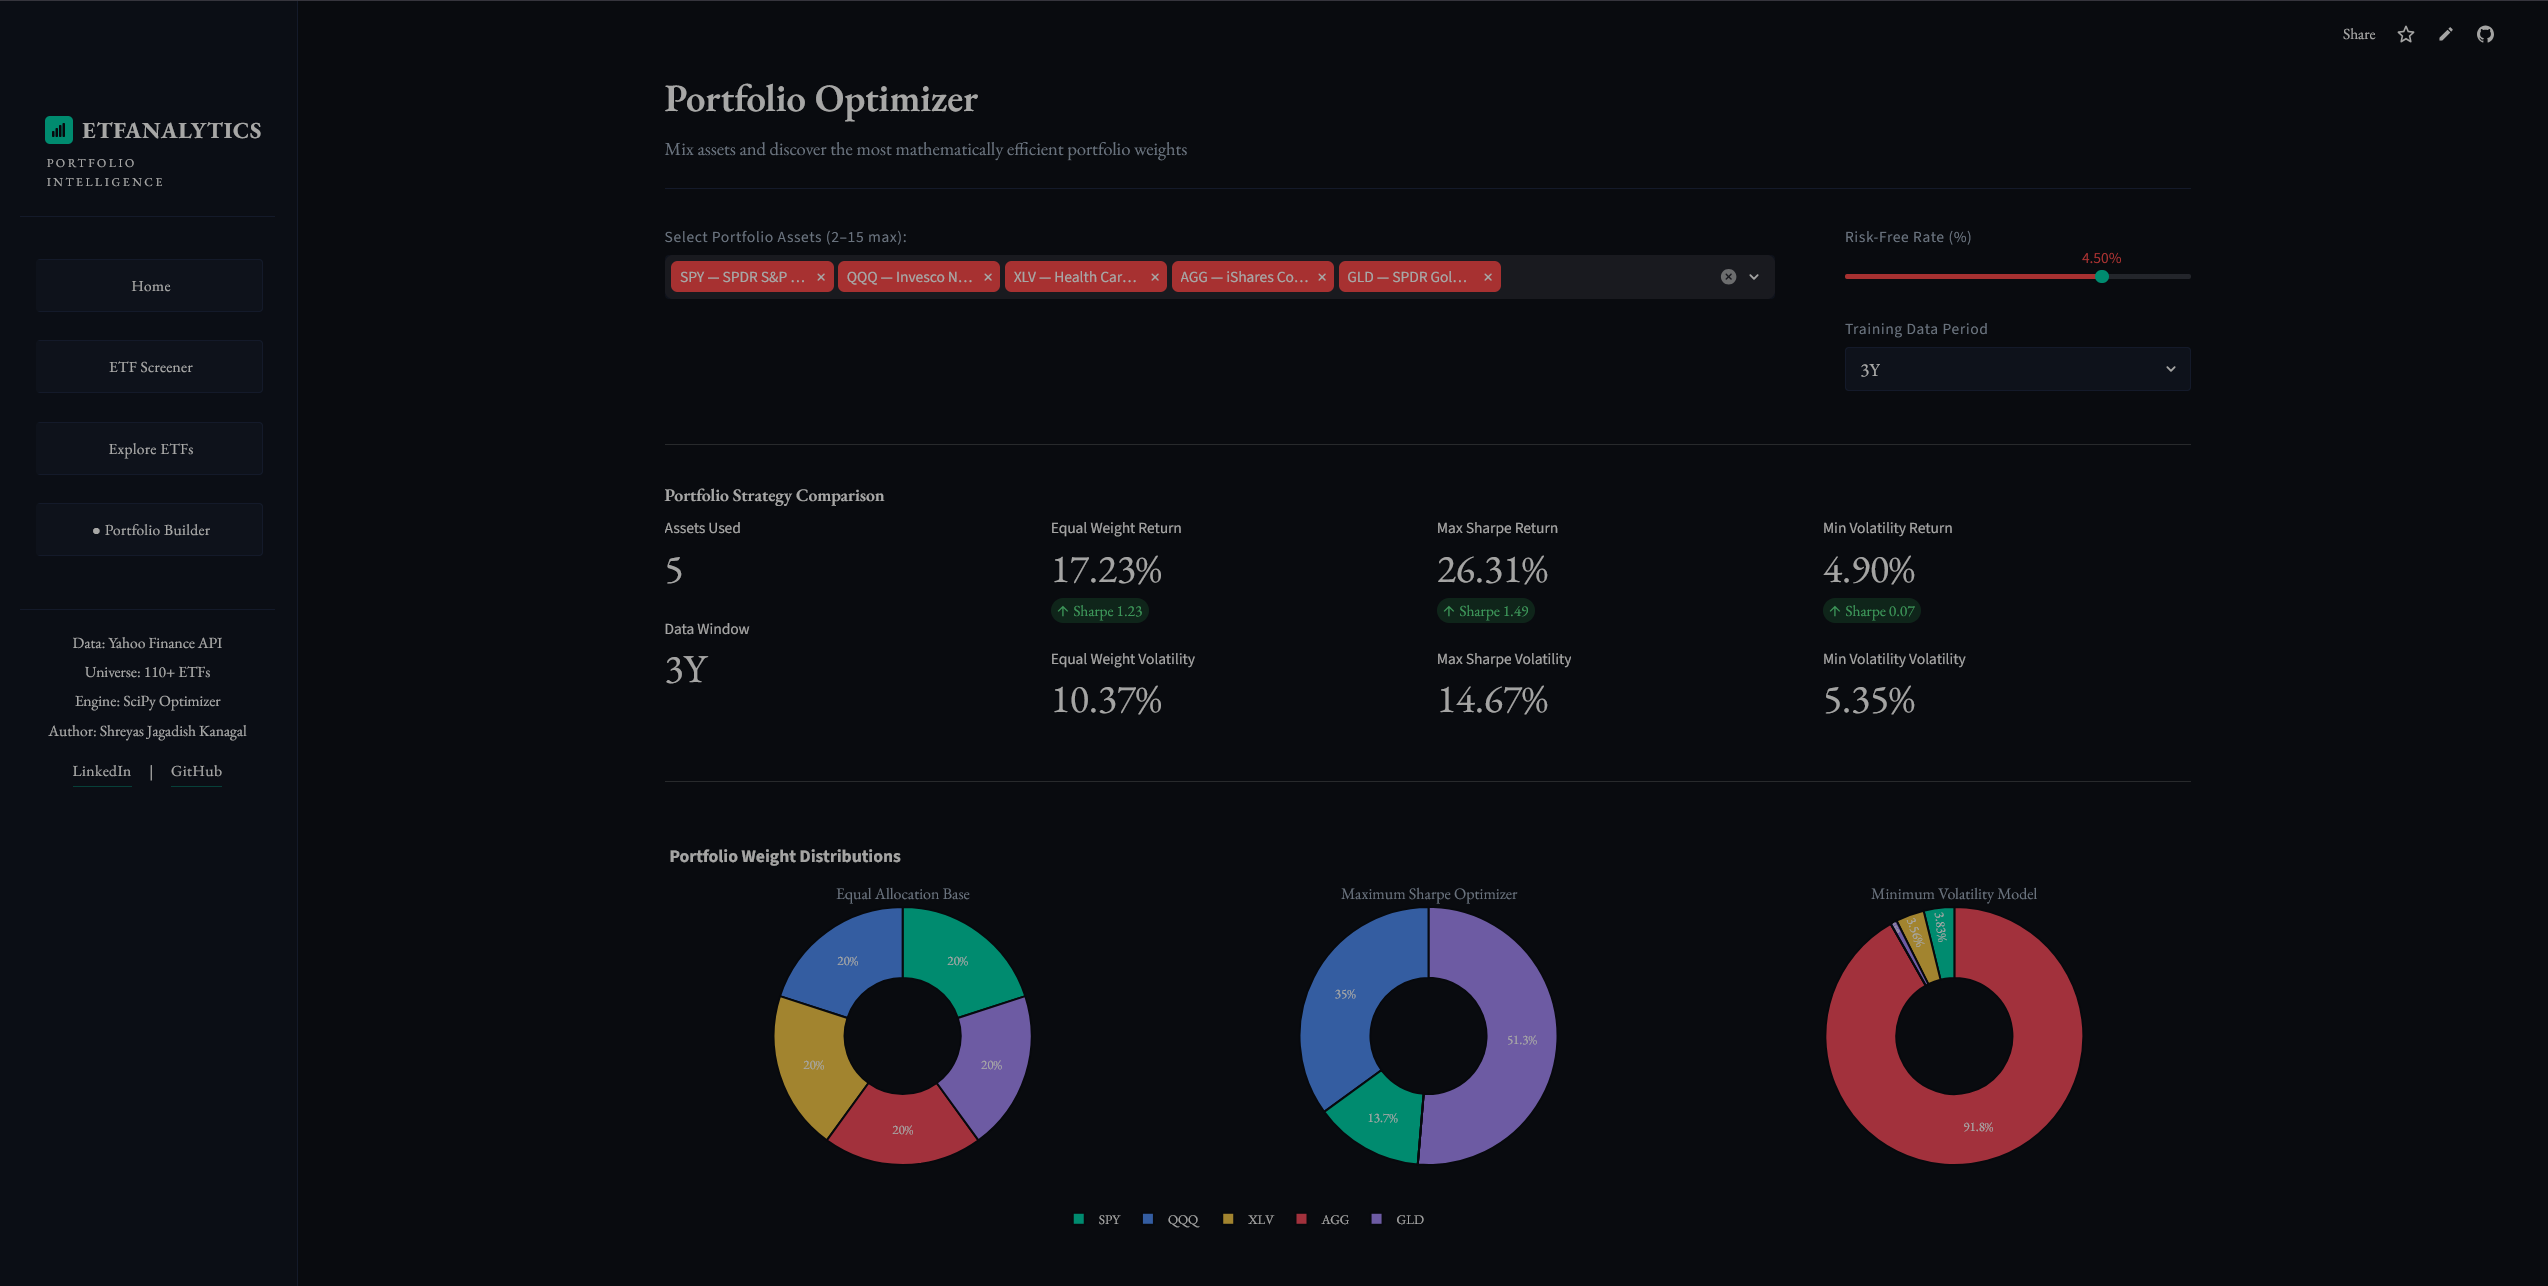
I work across the full analytics stack: SQL data modeling, Python automation, and dashboards in Power BI, Tableau, and Streamlit. Most of my personal work sits squarely in financial data: pipelines, investment analytics, and FP&A-style analysis.

I am actively pursuing internships & roles in Business and Financial Analytics to drive data-driven decision making.

Currently Building
A SQL-based financial analysis project: loading public company 10-K data (income statement, balance sheet, cash flows) from SEC EDGAR into a relational database, writing queries to calculate revenue growth YoY, gross margin trends, debt-to-equity, and operating leverage, then connecting Power BI to build an executive-level dashboard. Exactly the kind of work FP&A teams do day-to-day.

Outside of work

🏊 Competitive swimmer: swam at a professional level
🏋️ Weightlifting and staying active
🍳 Cooking and exploring new cuisines
🎯 Marksmanship: regular range practice
🌲 Hunting

Projects

Things I've built

Investment Analytics ● Live
Investment Performance Reporting Dashboard
A live analytics platform tracking 110+ ETFs across 14 asset sectors. Screen funds by risk-adjusted return, volatility, and drawdown. Includes Markowitz mean-variance optimization with an interactive efficient frontier visualization, all refreshed in real time.
110+
ETFs tracked
14
Asset sectors
Real-time
Data refresh
Python Streamlit Pandas SciPy Plotly Yahoo Finance API
FP&A · SQL · Power BI ● In Progress
Public Company Financial Analysis — SQL & Power BI
Loading 10-K filings (income statement, balance sheet, cash flows) from SEC EDGAR into a SQL database and writing queries to calculate KPIs analysts use every day: revenue growth YoY, gross margin trends, debt-to-equity ratios, and operating leverage. Power BI dashboard connects directly to the database for executive-level reporting.
SQL Power BI SEC EDGAR Python Pandas
More projects on the way.
Check back regularly.

Skills

Tools & Technologies

Languages
Python SQL R VBA
BI & Visualization
Power BI Tableau Streamlit Plotly Stata
Analytics & Modeling
Regression Analysis Time-series Forecasting KPI Development Portfolio Optimization Data Wrangling
Libraries & Tools
pandas NumPy SciPy statsmodels tidyverse ggplot2
Reporting & Automation
Excel PivotTables SharePoint SmartSheet REST APIs
Certifications
Google Data Analytics Bloomberg Market Concepts Google AI

Experience

Where I've worked

Oct 2023 – Jun 2024
TESO Life
Frisco, TX
Team Lead
  • Drove a 15% reduction in stockout incidents by analyzing weekly sales and inventory data in Excel (PivotTables, VBA) to surface demand patterns and restocking recommendations for leadership.
  • Streamlined reporting by building automated Excel workflows that consolidated daily performance data, cutting manual reporting effort by approximately 3 hours per week.
  • Led a 6-person team in a high-volume environment, managing task prioritization and shift workflows while presenting daily performance results to store management.

Education

Academic background

UTD
The University of Texas at Dallas
B.S. Economics · Minor in Business Intelligence & Analytics · Expected Dec 2026
GPA: 3.94 Richardson, TX Google Data Analytics Bloomberg Market Concepts

Let's connect

I am currently pursuing Business & Financial Analyst roles to drive data-backed investment and operational strategies. If you're building a team or just want to talk about data, finance, or cool projects, my inbox is always open. Let’s connect!